We tested the physical properties of Dursan coated stainless steel to see if it changed the stainless steel substrate.
Does the Dursan Process Change the Properties of Stainless Steel
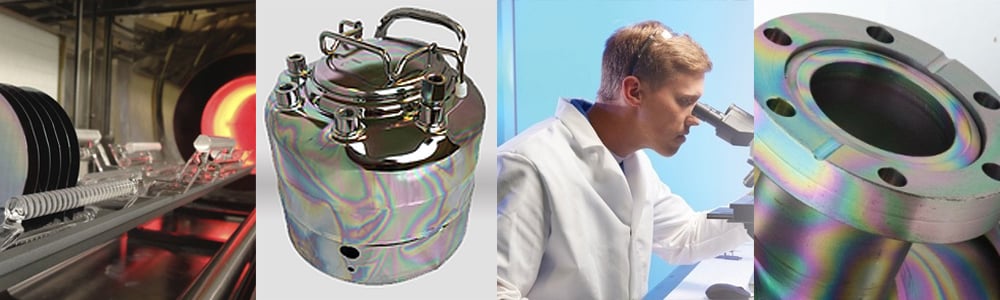
SilcoTek hired an external testing lab, Massachusetts Materials Research, Inc., to evaluate the bulk substrate properties of 316 stainless steel and the possible effects of a Dursan® process on those properties.
Comparative testing was performed on 316 stainless samples that were coated with Dursan, an untreated Control, and a heat treated in nitrogen control (with the same thermal deposition profile as Dursan) referred to as “Heat Sample”. Three types of material tests were performed on each sample in triplicate. The tests were Tensile Properties (at Room Temperature and 450° C), Charpy Impact, and Rockwell Hardness. In general, there was no significant variation in all tests for all three coupon types.
|
In this blog post you will learn:
- How Dursan® coated stainless steel samples perform under common physical performance tests.
- Determine if the thermal exposure of stainless steel parts during processing will impact the physical properties of stainless steel.
- How Dursan coated samples compare to uncoated stainless steel samples when subjected to tensile, impact, and hardness testing.
|
Background:
Customers have inquired whether the Dursan® process, which has a maximum process temperature of 450C, has any effect on the bulk metallurgical properties of the stainless steel substrate. Since it would be difficult to test all possible substrates, 316 stainless steel was chosen as a test substrate, which is one of the most common substrates used by SilcoTek customers.
The Dursan process was also chosen as an evaluation coating since it is the SilcoTek process that applies the highest temperature profile for the longest period of time, thereby illustrating a worst-case scenario for any potential detrimental thermal effects to the bulk substrate.

Testing
Three different samples were tested: 1) an untreated raw sample of 316 stainless steel referred to as “Control”, 2) the same 316 material subjected to the exact same thermal exposure as the Dursan process, but with inert nitrogen gas as the processing atmosphere, referred to as “Heat Sample”, and 3) the same 316 material coated with the standard application Dursan process, referred to as “Dursan”. The three tests were Tensile Strength measured at room temperature and at 450C, the Charpy Impact test, and Rockwell Hardness. Let's review the tests and how the samples performed.
Want to learn more about coating properties? Get our Coating Properties Quick Reference Guide. You'll get comparative data for all our coatings in this one page summary.

Tensile Strength (ASTM E8-16a)
This test involves a “dog-bone” test piece (see Figure 1). The test piece is mounted in a device that holds the two thicker ends and applies opposing force in the directions of the red arrows as shown in Figure 1.
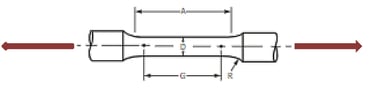 Figure 1: Illustration of Tensile Strength test coupon.
The instrument measures the Ultimate Strength in psi. This value (also known as the Tensile Strength) is calculated by dividing the maximum force carried by the specimen during the tension test by the original cross-sectional area of the specimen.
The Yield Strength is measured in psi. This is the stress at which there is a 0.2% plastic elongation of the coupon. % Elongation in 4D is also reported, which is the % of elongation measured on the coupon whose gage length (G) is 4 times its gage diameter (D). The % Reduction of Area is the proportional reduction of cross-sectional area at the plane of fracture after fracture. Finally, the location of the fracture is reported. This test was performed twice: at room temperature and at 450° C for each specimen.
Charpy Impact (ASTM E23-12c)
This test involves the single beam (Charpy) impact testing of notched bar of specified dimensions (Type C). The mounted specimen is impacted by a pendulum-activated striker at a known force. The Energy of Rupture (i.e. force of the strike) is noted as well as whether or not there is visual breakage to the test piece. There were three test pieces for each specimen type (Dursan-coated, untreated, heat-exposed), for a total of 9 tests.
Rockwell Hardness
Rockwell hardness is measured pushing an indenter to generate the indentation hardness of a material. The value is dimensionless and correlates linearly with tensile strength of the bulk material. Testing was performed using a tungsten carbide ball indenter to generate RBW data.
A summary of the tests can be seen in the table below. The results indicate the Dursan coating process does not significantly change the material performance of stainless steel.
|
Tensile Properties (ASTM E8-16a) at Room Temp
|
Control
|
Heat Sample
|
Dursan Coated
|
|
Ultimate Strength (psi)
|
93,000
|
96,000
|
96,000
|
|
0.2% Yield Strength (psi)
|
49,600
|
52,000
|
52,000
|
|
% Elongation
|
56
|
54
|
53
|
|
% Reduction of Area
|
78
|
79
|
77
|
|
Break Location
|
Gage
|
Gage
|
Gage
|
| |
|
|
|
|
Tensile Properties (ASTM E8-16a) at 450°C
|
Control
|
Heat Sample
|
Dursan Coated
|
|
Ultimate Strength (psi)
|
71,500
|
70,000
|
76,500
|
|
0.2% Yield Strength (psi)
|
31,500
|
30,800
|
32,600
|
|
% Elongation
|
37
|
36
|
40
|
|
% Reduction of Area
|
74
|
73
|
71
|
|
Break Location
|
Gage
|
Gage
|
Gage
|
| |
|
|
|
| |
|
|
|
|
Charpy Impact (ASTM E23-12c) Energy of Rupture (Ft/lbs)
|
Control
|
Heat Sample
|
Dursan Coated
|
|
sample 1
|
264
|
264
|
264
|
|
sample 2
|
264
|
264
|
264
|
|
sample 3
|
264
|
264
|
264
|
|
average
|
264
|
264
|
264
|
|
NONE OF THE SAMPLES BROKE
|
|
|
|
| |
|
|
|
| |
|
|
|
|
Rockwell Hardness (RBW)
|
Control
|
Heat Sample
|
Dursan Coated
|
| |
94
|
93
|
94
|
Conclusion
A metallurgical testing comparison of tensile strength, impact resistance and hardness on untreated 316 stainless steel, Dursan coated 316 stainless, and 316 stainless exposed to the Dursan heat profile under a nitrogen atmosphere revealed no significant variance between all three test samples, with only slight improvements in tensile properties for the Dursan and Heat Sample test pieces.
The R&D Team continues to test our coatings under the most demanding conditions to understand chemical vapor deposition benefits and limitations in order to provide our customers with the most relevant coating performance data available.
We'll soon be offering a new e-book that is a compellation of years of material testing and coating evaluation. If you would like an early edition of our latest e-book, contact our Technical Service Team and we'll send you a preview copy.
Want to keep in touch with our latest coating developments? Stay engaged by signing up for our email and blog; or follow us on LinkedIn.