Reliable trace level VOC analysis is an important factor when measuring air quality. How to improve analysis quality? The Key-VOCs project studied VOC measurement. Here's what they found out.
|
In this blog post you will learn:
- Test protocol for VOC analysis and air quality measurement
- How surface reactivity can impact VOC analysis results
- How the Key VOCs team has developed measurement methods for VOC surface interaction
- How inert coatings, improve test reliability over most common passivation techniques.
|
The Key VOCs team completed a major volatile organic compound (VOC) study funded by EURAMET, the Meteorological Observatory Hohenpeissenberg of DWD (the German Meteorological Service) and partnered with the European Metrology Research Programme. Their final report on VOC analysis, "Metrology for VOC Indicators in Air Pollution and Climate Change" is helping to advance the science of trace VOC measurement.

The team developed test methods to quantify sources of VOC interaction and loss. The project identified suitable materials that prevent adsorption of VOCs and improve measurement techniques. The team also developed sensor based measurement systems for key VOCs in air. The Key VOC team chose SilcoTek coatings for their study because we offer the expertise, support, and inertness needed to provide an inert sample flow path for highly reliable trace VOC analysis.
Read the Complete Key VOCs Study
About trace VOC measurement and why it matters in air quality monitoring.
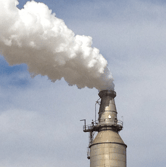 Volatile organic compounds (VOCs) have been linked to health issues, air pollution, green house gasses and ozone pollution. According to the World Health Organization, 7 million people died from the effects of air pollution in 2012, mostly due to pollution caused from the burning of fossil fuels. VOCs are a contributing factor to pollution deaths because they are emitted during the burning of fossil fuels. Additionally, VOCs impact indoor air quality and are present in household chemicals, and emitted during production processes. Accurate sampling and analysis of volatile organic compounds have become critical to understanding and mitigating their impact to our environment.
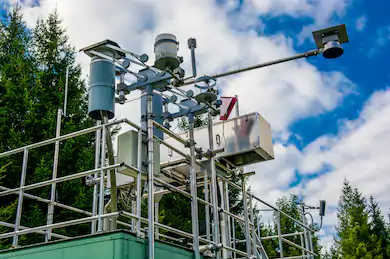
Reliable sampling and analysis of trace compounds is becoming increasingly difficult because mandated detection limits are being reduced as the impact of trace pollutants become fully understood for both indoor and climate monitoring. Now with the advent of EPA 325, refinery fenceline monitoring, the reliability and inertness of sample transport and analytical systems has become increasingly vital to business, and the environment.
Unfortunately VOCs can react with and be adsorbed by stainless steel, aluminum, and other sample pathway surfaces. If flow path surfaces react with the analyte, it's difficult to get reliable trace analysis results. Problem areas include:
- Calibration gas cylinder walls retaining and degrading VOC standards, causing variation in cal gas quality.
- Sample tubing adsorbing and desorbing volatile organics resulting in false positive or false negative results.
- Fritted filter adsorption of volatiles
- Exposed stainless steel in valves and fittings reacting with volatiles
The study found that contact surfaces can cause VOCs to react and change depending on the material. This dictates how calibration and samples should be stored, transported and analyzed. The study found existing aluminum passivation technologies offer marginal benefits at trace levels and transport tubing material can have a big impact on analyte retention and loss.
Want to learn more about how to achieve reliable whole air sampling and get practical techniques needed to achieve success?
Read "A Guide to Whole Air Canister Sampling" from Restek® Corporation.
Cylinder Passivation Comparison for VOC Calibration and Storage
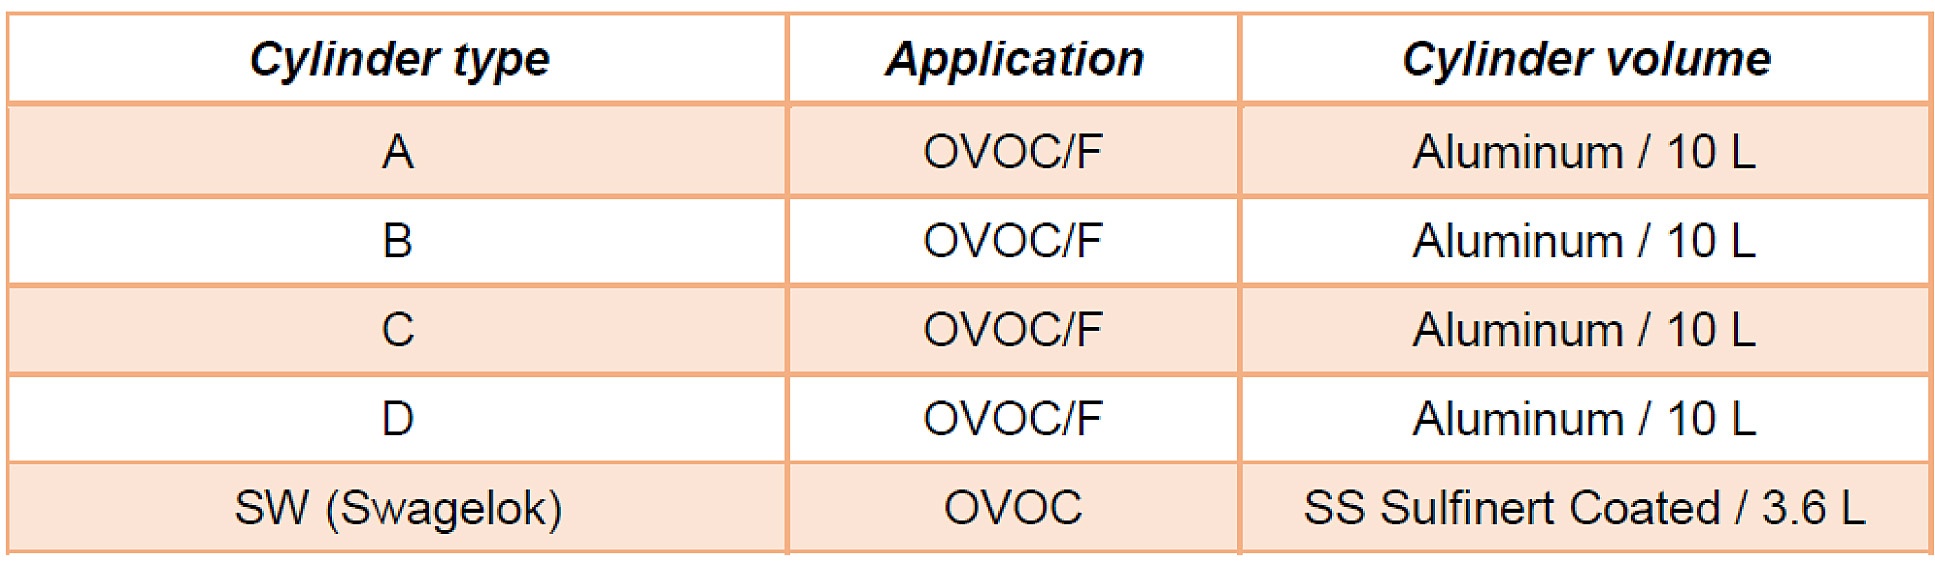
The team studied the adsorption and loss of VOCs in gas cylinders. They compared 4 passivated aluminum cylinders from specialty gas producers like Takachiho, Air Liquide, Air Products, and Linde. In the study the cylinders are randomized and designated as cylinders A-D to eliminate bias. One additional cylinder was compared, designated SW. That cylinder was a stainless steel cylinder coated with SilcoNert® 2000. Here are the designated cylinders, below. Note the SilcoNert 2000 cylinder (shown under the trade name Sulfinert®) is much smaller than the other cylinders. This could impact the reaction surface area as the analyte in the smaller cylinder has a much higher exposure to the cylinder wall (volume to wall surface area ratio). So in this test the coated cylinder has the disadvantage.*
The study noted the following test parameters: "The first part of the research consisted of quantitatively studying the adsorption of VOC at trace levels for a selection of different aluminum and stainless steel pressurized cylinders having proprietary passivation treatments. A batch of gas mixtures containing several OVOCs, including methanol, ethanol and acetone, at 100 nmol/mol, a batch containing formaldehyde (F) at 1 µmol/mol and a batch containing several monoterpenes (MT) at 2 nmol/mol have been prepared using state-of-the-art gravimetric preparation methods (ISO 6142-1)." The report diagrammed the decanting and analysis below.*
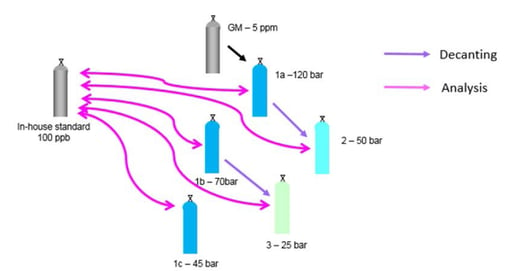
The study went on to clarify the decanting result summary below: "When the decanting effect (deviation of the concentrations of the daughter cylinder/mixture from the mother cylinder/mixture) is within 5%, the symbol “+” is used. This symbol indicates that the type of cylinder is suitable for the component; when the decanting effect is between 5% and 10%, the symbol “-” is used. This symbol indicates that the type of cylinder is less suitable. When the decanting effect is above 10%, the symbol “▬” is used. This symbol indicates that the type of cylinder is not suitable for the tested component. The symbol “(-)” means that the effect is close to “less suitable”, and the symbol “(+)” close to “suitable”. "*
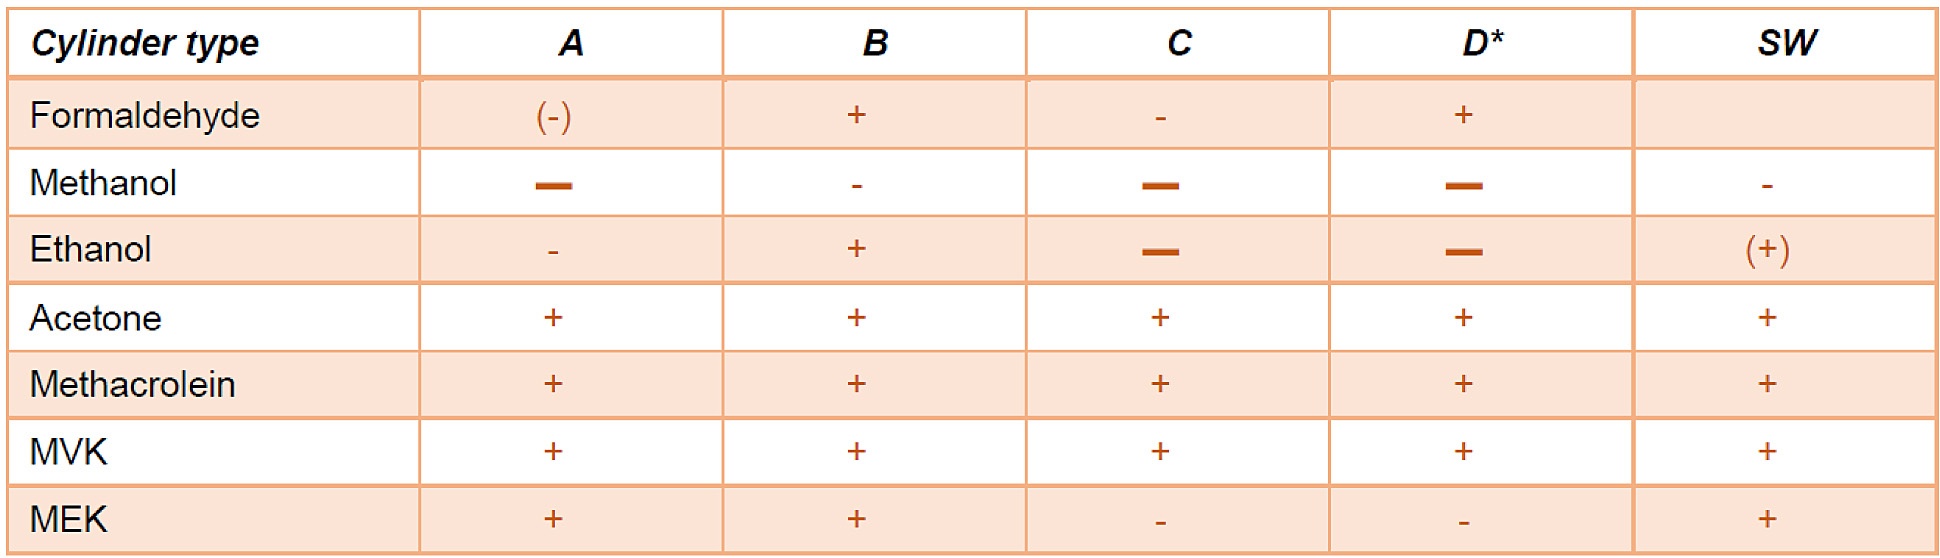
The results indicate that despite the adverse cylinder surface area to volume ratio, the SilcoNert 2000 coating exceeded the performance of most passivation treatments.
Methanol Comparison
The VOC team then compared 10 meter lengths of SilcoNert 2000 coated and uncoated stainless steel tubing (below). The team passed a 180 umol/mol methanol mixture through a bypass (grey areas), then switched to the test tubing. They measured the time to achieve baseline concentration for each tube. The SilcoNert coated tube took less than a minute to stabilize (graph B) compared to over 40 minutes for the stainless steel tube (graph A). The comparison demonstrates the severe adsorption of trace methanol on stainless steel flow path surfaces and highlights potential delays in response that can lead to significant data reliability issues when conducting trace VOC analysis.*
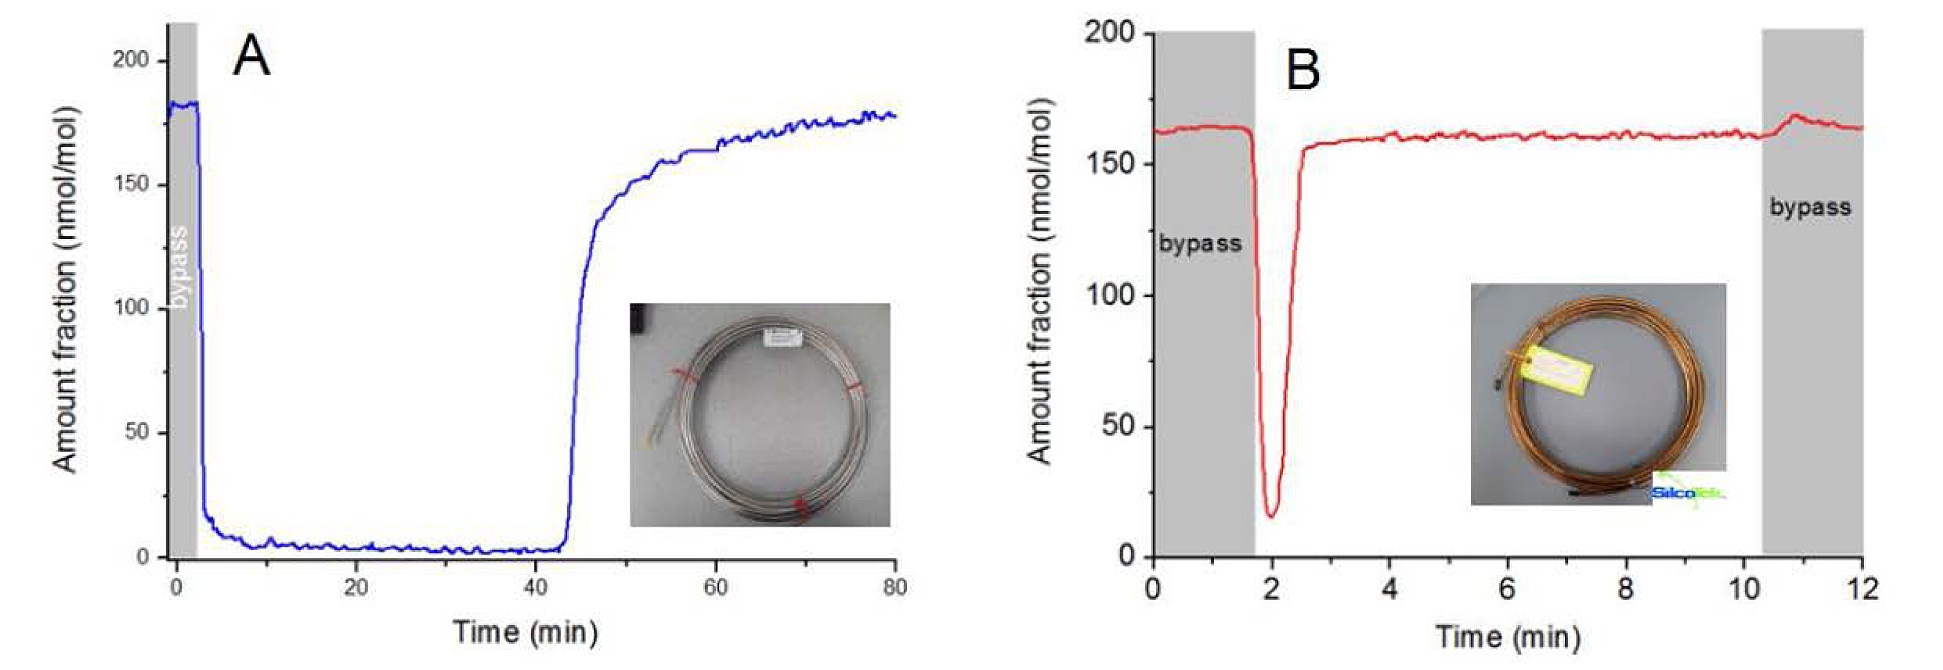
Overall the least methanol adsorption was observed for polymer sampling lines (like PTFE, and FEP) but porosity/permeability, high temperature stability and durability issues limit their effectiveness in the field. It was found that at elevated temperatures (50 to 100°C) polymer tubing emitted trace compounds which can lead to unwanted or spurious signal peaks. The SilcoNert coating is stable to 450°C and emits no trace compounds during heating.
The study stated: "The adsorption by most polymers such as PTFE and FEP is extremely low, while for uncoated metals it is very high. Coated stainless steel with Silconert-2000 and Sulfinert are the preferred choice, as they also have the benefit of being robust non-permeating materials."
Selecting the Right Surface for VOC and Air Quality Analysis
Selecting inert and durable materials for sampling critical flow path surfaces can be a key factor in successful analysis. Mr. Stefan (S.T.) Persijn of VSL, Dutch Metrology Institute, (in conjunction with the German Meteorological Office, DWD) presented a comparative study of adsorptive properties of various materials commonly used in VOC analysis.*

The study exposed various tube surfaces to methanol at 50 and 100°C and measured adsorption rate of the surfaces. Results show that an inert coating like SilcoNert® coated stainless steel prevented adsorption and reaction with VOCs in critical flow paths. The study summary, below, highlights the comparative results:*

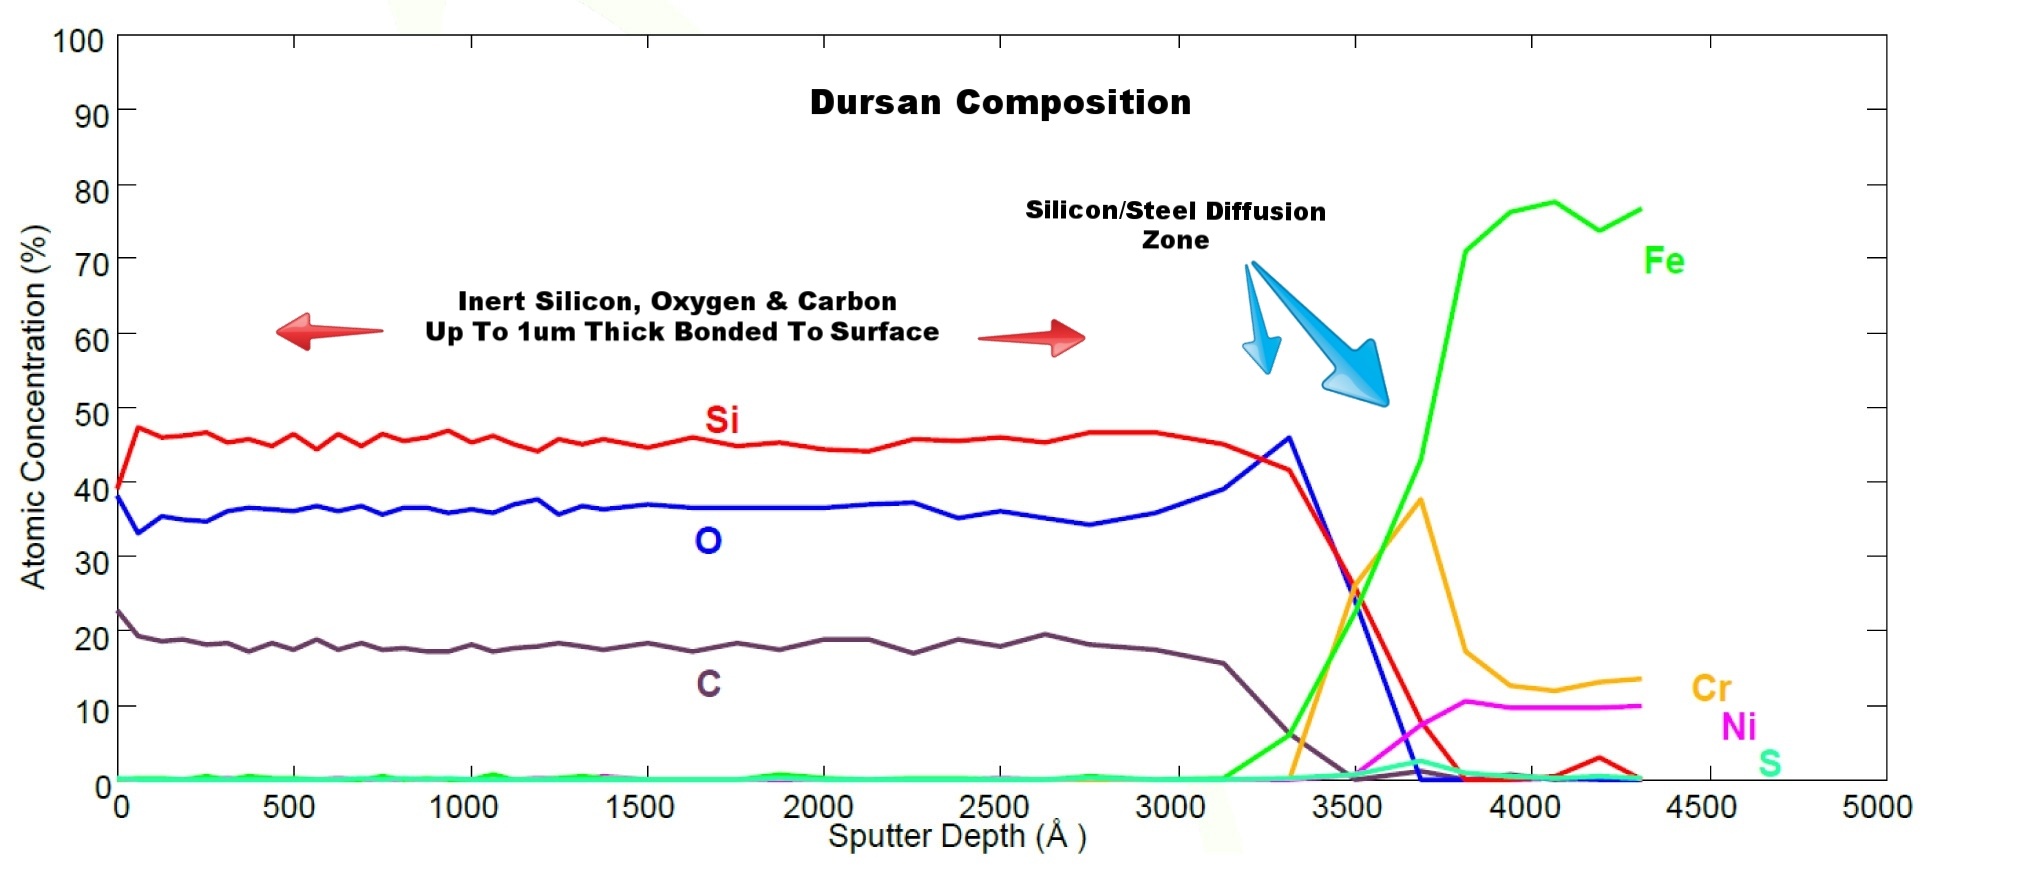
The untreated stainless steel readily adsorbs active compounds with complete loss of methanol. Electropolishing will smooth the surface and reduce overall surface area but adsorption is still significant. PFA and PEEK tubing require careful management of the surface in order to achieve acceptable results. Sulfinert® coated stainless steel does not adsorb active compounds because the inert silicon CVD surface bonds to and diffuses into the stainless steel substrate, preventing interaction with reactive sites. The sputter depth profile (below) characterizes the diffusion zone of a typical SilcoTek CVD coating.
The Key Factor in VOC Analysis? An Inert Flow Path.
Be sure to coat the entire flow path to prevent selective adsorption by reactive surfaces. Not coating a fitting or fritted filter can significantly impact analytical results and can cause calibration failures, increased system maintenance, false positive/negative results, frequent retesting, and potential regulatory compliance issues. To understand how our coatings improve performance to to our Chemically Inert Coatings page.
Coated flow path surfaces include:
- Whole air sampling canisters
- Regulators & mass flow control
- Valves
- Fittings
- Tubing
- Liners (yes we can coat glass)
- Fritted filters
- Sample cylinders
- GC, FTIR, and instrument components
|
 ** ** |

*Images and data courtesy of The Dutch Metrology Institute (VSL) and the German Meteorological Office (DWD) presented at the Key VOC joint project April 21st 2016, in Paris, France.
** Image courtesy of Restek® Corporation

