Learn how we pushed the boundaries of silicon heat resistance and improved the thermal stability of Silcolloy.
Improving Heat Resistance of Silicon Coatings
In our previous blog post, we learned that among the current commercially available SilcoTek® coatings, Silcolloy® has been the go-to recommendation for most high temperature (≥ 450°C) applications. Silcolloy is made purely of hydrogenated amorphous silicon (a-Si) with no additional surface functionalization. We learned that amorphous silicon is an excellent barrier against corrosion, especially oxidation (which is a form of corrosion). We also learned that Silcolloy seems to have the best chemistry (among SilcoTek products) to handle high temperature applications.
However, Silcolloy® does have its Achilles’ heel in that amorphous silicon starts to crystallize at around 700°C. This is an intrinsic materials property of amorphous silicon, as shown in our previous TGA-DSC study on a-Si particles as noted in our previous blog post. The TGA-DSC experiment investigated stand-alone a-Si particles (not a coating attached to a substrate), therefore the properties measured reflect the inherent attribute of a-Si regardless of any substrate. In this blog post we discuss how SilcoTek has successfully enhanced the thermal performance of amorphous silicon coatings.

When amorphous silicon (a-Si) is deposited as a coating on top of a metal substrate, the silicon crystallization may often occur below 700°C because many metals catalyze the silicon crystallization process to trigger the transition before it reaches the intrinsic crystallization temperature. For example, amorphous silicon deposited on aluminum starts to crystallize as early as around 400°C, while for stainless-steel, this transition occurs around 600°C.
|
In this blog post you will learn:
- How to reduce metal catalysis effects on heat resistant amorphous silicon coatings.
- How to test and compare silicon coating surfaces
- Get comparative results for heat resistance performance of Silcolloy® and improved Silcolloy with primer layer.
- How a primer layer is effective at preventing premature silicon crystallization.
|
Reducing Metal Catalysis
Since metal in direct contact with amorphous silicon (a-Si) is the cause for premature silicon crystallization, the approach we took to eliminate this impact is by adding a primer layer between the metal substrate and the Silcolloy® coating. The primer layer must meet the following requirements to be successful:
- It must act as an effective diffusion barrier to isolate the metal from Silcolloy®
- The primer layer itself is immune to metal-catalyzed crystallization below the intrinsic crystallization temperature of Silcolloy
- It should bond well to both the metal substrate and Silcolloy
- It can be easily integrated into the current CVD process to be production friendly
We successfully developed such a primer layer that met all the above criteria. The Silcolloy coating deposited with a primer layer will be referred to as “RD15” in this blog post. In comparison, the standard Silcolloy without the primer layer will be referred to as “SOP”. Figure 1 below illustrates the difference between these two versions of Silcolloy.
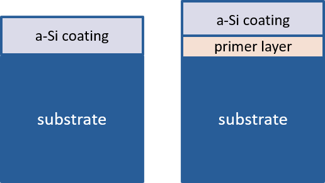 Figure 1: Coating structures of SOP-Silcolloy amorphous silicon (a-Si), left vs. RD15 (amorphous silicon with primer layer), right.
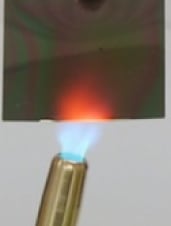
To assess the effectiveness of the primer layer, 316L stainless-steel coupons coated with SOP-Silcolloy (SOP) and improved Silcolloy with primer layer (RD15) were exposed to 600°C in air for six hours. Raman spectra (using 488 nm laser) were collected on the coupons before and after the thermal exposure. Raman is an excellent tool for identifying amorphous and crystalline silicon phases.
Figure 2 shows that RD15 maintained the amorphous silicon nature after this thermal exposure, whereas SOP experienced the amorphous-to-crystalline transition and subsequent silicon oxidation as illustrated by the sharp and intense c-Si peak at 522 cm-1 and the broad Si-O peak near 1000 cm-1. This experiment confirmed that the primer layer is indeed effective at preventing premature silicon crystallization.
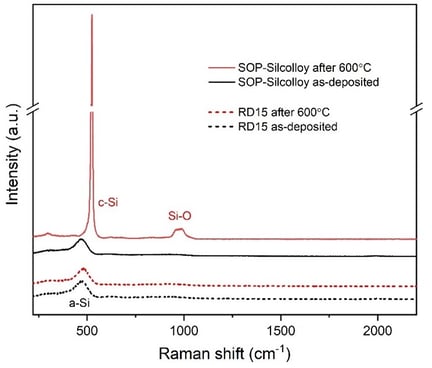 Figure 2: Raman spectra comparison after 600°C thermal exposure
It was mentioned earlier that the intrinsic crystallization temperature for silicon is about 700°C, and this is an inherent materials property that will not be impacted by a primer layer. To confirm this, we repeated the same Raman experiment but raised the thermal exposure temperature to 700°C, while keeping all other parameters the same.
Figure 3 (below left) shows that both SOP and RD15 turned crystalline after the 700°C thermal exposure, as expected, but a closer look (inset) revealed a blue shift (from 522 in SOP to 527 cm-1 in RD15) for the c-Si peak. Similar Raman peak blue shifts in c-Si has been reported in the literature as an indication of stress for c-Si.
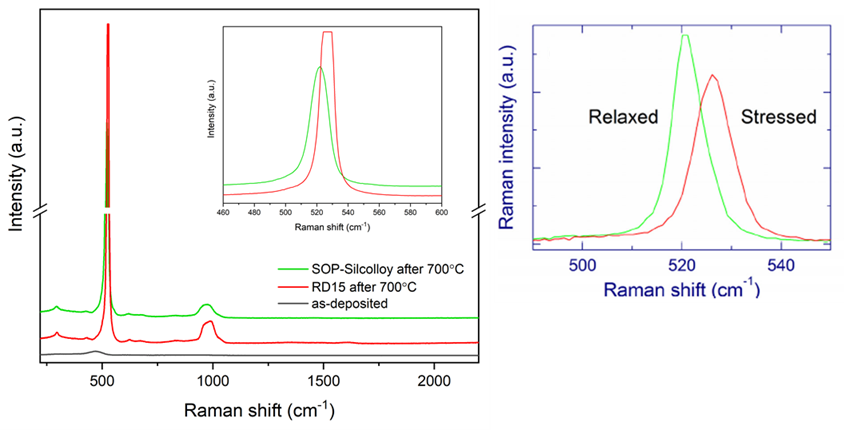
Figure 3: left - Raman spectra comparison of RD15 and SOP after 700°C thermal exposure (for 6 hours in air). Inset is a blowup comparison showing the Raman peak blue shift by about 5 cm-1 in RD15; right – literature report of similar Raman shift in c-Si due to compressive stress experienced by Si nanocrystals1,2
One study of Si/SiO2 superlattice films described such a Raman blue shift (Figure 3 right).1,2 The superlattice films contain silicon grains embedded in a solid SiO2 film matrix. A laser irradiation is used to melt the silicon grains, which then quickly crystallize to form silicon nanocrystals, resulting in a volume increase of the embedded silicon and a consequent compressive stress about 3 GPa. This stress can be relieved with a lower power laser anneal, and the relaxed structure exhibited a Raman peak characteristic of freestanding crystalline silicon (521 cm-1), as shown in Figure 3 right.
The similarity between the peak shift we observed and what was reported in the literature seems to suggest a similar mechanism. We speculate that in the SOP film, the crystallized silicon grains experience no stress because they are not structurally constrained. In the RD15 film, on the contrary, the primer layer acts as a matrix in which the silicon crystallites are embedded, similar to the Si/SiO2 superlattice, and that constriction provides the source of the stress. SEM images taken on sample coupons after thermal exposure seem to provide supporting evidence, which will be discussed later in this blog post.
Improving Heat Resistance: Can the Enhanced Silicon Layer Improve Thermal Stability?
Since both coatings crystallized at 700°C, does it mean that the benefits provided by the primer layer stop at the intrinsic crystallization temperature, and beyond that point the two coatings perform equally? A closer examination revealed a somewhat unexpected but encouraging answer. The primer layer, it appeared, not only prevents premature crystallization of silicon, but also acts as a stabilizing matrix for the silicon coating once crystallization does occur, limiting the degree of structural disruption and damage imposed by the crystallization event. As a result, RD15 retains much of its barrier properties after thermal exposure, demonstrating superior thermal stability compared to SOP-Silcolloy.
Figure 4 (below) compares the visual evolution of the two coatings starting at the baseline condition (as-deposited), and going through the different thermal exposures (all held at the peak temperature for six hours in air). The SOP coating showed a more drastic change in color once reaching 700°C, turning dark brown first, then completely black at 800°C. The RD15 coating maintained a rainbow appearance (with some change in color) throughout the heating process.
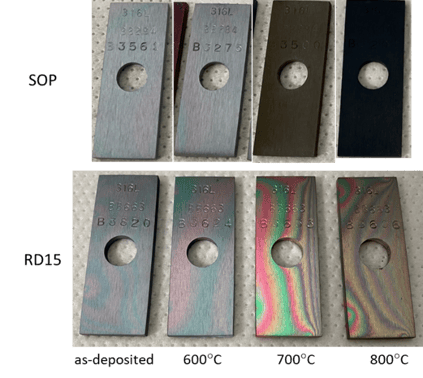 Figure 4: Visual evolution of the two coatings going through thermal exposure (all carried out for 6 hours in air)
SEM (Scanning Electron Microscope) images were taken on individual coupons through the thermal exposure stages, to correlate the macroscopic visual evolution with microscopic structural changes in the coating, as shown in Figure 5.
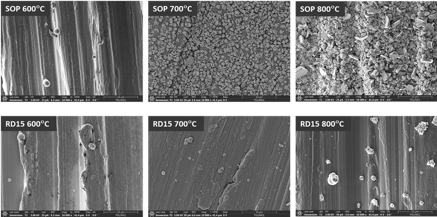
Figure 5: SEM images of the two coatings (all taken at 10K magnification) after thermal exposures to 600, 700 and 800°C for 6 hours in air.
In addition, EDS (Energy Dispersive Spectroscopy) maps of silicon Ka1 line are displayed in Figure 6, which can be used as an indicator of coating coverage on the substrate surface. Elemental silicon is represented in blue; the continuity and relative intensity of the blue color reflect the continuity and relative thickness of the coating. A lack of blue signifies a discontinuity in the coating.
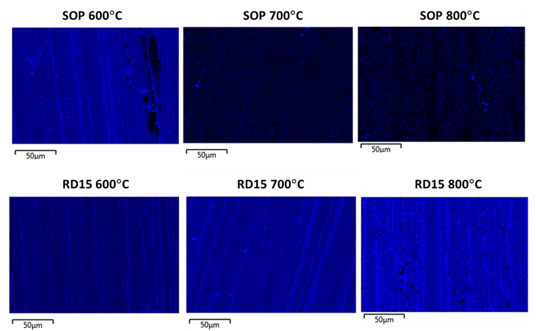
Figure 6: EDS maps of silicon Ka1 line (represented in blue), used as an indication for coating coverage, for the two coatings after thermal exposures to 600, 700 and 800°C for 6 hours in air.
Figures 5 and 6 together deliver a consistent and clear message: the SOP coating suffers significant structural damage and coverage degradation as the temperature rises, while the RD15 coating displays respectable structural integrity and coverage continuity under the same conditions.
At 600°C, both coatings appeared smooth and unaltered under SEM, but small coating gaps started to show in the EDS map of SOP, likely due to the onset of crystallization confirmed by Raman (Figure 2). At 700°C, the crystal grains broke out in islands, the silicon intensity became much weaker and the film coverage appeared mostly discontinuous for SOP. Finally at 800°C, the surface of SOP was dominated by a mixture of metal (from the 316L stainless-steel substrate) and crystalline silicon grains, and the silicon signal detected by EDS weakened even more.
The RD15 coating, on the other hand, remained smooth and continuous under the same exposure conditions and only began to show some void spots in the film at 800°C according to the EDS map. These void spots contain high manganese (Mn) and oxygen (O), indicating that the coating was replaced by manganese oxide at these spots. The SEM images of RD15 after thermal exposure provided support to our earlier speculation that the primer layer acts as a stabilizing matrix in the event of crystallization, a barrier to slow down and reduce the associated damage from crystallization and metal diffusion, as we can see that even though it did not completely stop localized disruptions (especially at 800°C), it did help the coating stay in place and survive the thermal exposures considerably better.

Summary
Part 2 of our heat resistance blog series focused on a recent thermal stability property improvement of SilcoTek’s Silcolloy® coating. The new coating, known as RD15 in this study, contains a primer layer that segregates the amorphous silicon coating from the metal substrate, while maintaining the same surface chemistry as Silcolloy. The new coating has effectively eliminated metal-induced silicon crystallization below the intrinsic silicon crystallization temperature, as proven by Raman spectroscopy.
In addition, the primer layer also acts as a stabilizing matrix for the silicon coating once crystallization does occur, limiting the degree of structural disruption and damage imposed by the crystallization transition.
In part 3, and final part of our series, we'll go back to the basics and remove the coating to see if the new Silcolloy coating improves oxidation resistance and corrosion resistance of the underlying stainless steel.
Learn more about our corrosion resistant coatings. To stay abreast with the latest in coating technology, subscribe to our blog and email or follow us on LinkedIn.

References:
- Nikitin, T. et al. “Optical and structural properties of Si nanocrystals in SiO2 films” Nanomaterials 2015, 5, 614.
- Nikitin, T. et al. “Optical memory of silicon nanocrystals with submicron spatial resolution and very high thermal stability” Applied Physics Letters 2009, 94, 173116.

